
Background Radiation Has Increased By 600 To 60,000 Percent Globally, State By State In USA - 0 Before Nuclear Age, 1 mSv In 1950 To Over 6 mSv Today; Physicist Dr. Paolo Scampa, Dr Busby Weigh In On Evidence, Data, Root Causes
THERE WERE NONE OF THE 1,900 MAN MADE HEAVY METAL RADIOACTIVE NUCLEAR INDUSTRY CREATED POISONS IN THE WORLD PRIOR TO THE CARBON FUEL/ NUCLEAR FUEL, ATOMIC BOMB AGE
Every single nuclear plant, nuclear accident site, nuclear disposal site, medical radiation facility, uranium mines, nuclear fuel processing facilities, nuclear fuel reprocessing facilities and anything nuclear or fossil fuel related releases large quantities of radioactive heavy metal poisons into the air.
Fukushima is just one example of many sites that are releasing huge amounts of radioactive poisons, despite being 'shut down' or not producing anything of value.
Because radioactive heavy metal poisons are invisible and not detectable to the senses, the public does not know or sense anything is going wrong. The public does not even know that it does not know anything.
The nuclear industry loves to keep everyone in the dark, because if the truth were known, the nuclear industry would be shut down today.
RADIOACTIVE HEAVY METAL POISON CONTAMINATION OF THE WHOLE WORLD IS EPIDEMIC, ONGOING AND SHOWS NO SIGNS OF SLOWING DOWN OR STOPPING THANKS TO NUCLEAR AND FOSSIL FUEL INDUSTRIES

from a distanceAugust 9, 2015 And here you have it. Proof that these dangerous radionuclides were not in the world prior to nuclear energy, etc. → The pro-nukes have a hard time grasping that simple fact.
"CESIUM-137 AND OTHER GAMMA RADIOACTIVITY IN THE FLORIDA ENVIRONMENT – A STUDY OF SELECTED MEDIA" by CHARLES ERVIN ROESSLER
“Eisenbud points out that the world Inventory of radioactive materials prior to World War II, both In the environment and in the laboratory, was confined to those which occurred in nature, with the exception of a relatively few millicuries of radioactivity produced in cyclotrons during the late 1930's. Construction of large nuclear reactors during the war and the associated operations for extracting plutonium from irradiated uranium resulted in the first extensive occasions for contaminating the environment with radioactive substances.”
Source: http://ufdcimages.uflib.ufl.edu/UF/00/09/82/13/00001/cesium137otherga00roes.pdf

Radioactive Carbon 14 From Nuclear Power Plants Causing Deforestation, Fungus Infections, Disease And Death Of Trees, Humans, Animals And Plants Globally - Plus Global Warming Effect
http://agreenroad.blogspot.com/2014/05/carbon-14-emitted-by-nuclear-power.html

HUGE INCREASES IN RADIOACTIVE CARBON 14 BEING DOCUMENTED IN TREES AND PLANTS GLOBALLY; IT IS BEING ABSORBED AFTER BEING EMITTED BY NUCLEAR PLANTS, FOSSIL FUEL BURNING
Radioactive Carbon 14 From Nuclear Power Plants Causing Deforestation, Fungus Infections, Disease And Death Of Trees, Humans, Animals And Plants Globally - Plus Global Warming Effect
http://agreenroad.blogspot.com/2014/05/carbon-14-emitted-by-nuclear-power.html
DR BUSBY SAYS BACKGROUND RADIATION IS INCREASING GLOBALLY DUE TO NUCLEAR INDUSTRY
Every nuclear facility is leaking, all of the time. The older they get, the bigger and worse this leaking becomes.
Dr. Chris Busby and other nuclear professionals discuss how the background radiation is increasing all over the globe due to the huge radiation releases, leaks and nuclear plant accidents year after year of radioactive man made elements.
 The 'maximum' radiation no civilian should be exposed to has now been raised by orders of magnitude since 1975, to a whopping 1 m/Sv per year.
But even this is not enough, because Fukushima released an estimated 50 times the radiation of Chernobyl, thus massively increasing the background radiation globally, and especially in Japan.
But the general allowed maximum background level does not include the above amounts which can be found in contaminated foods and drinks.
In addition, the entire food chain bio accumulate and bioconcentrates radiation all the way from the bottom to the top, thus making this huge issue even worse.
WHAT WERE THE BACKGROUND RADIATION LEVELS BEFORE THE ATOMIC AGE?
According to Veteran's Today, it seems like the background radiation levels have increased radically since the beginning of the atomic age...
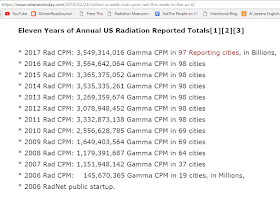
The radiation monitors in Miami run 24 Hours a day, 7 days a week, 365 days a year and include holidays and Leap Years. The Radiation Count in Miami exceeded 1,117 CPM for the last 11 months and 12 days.

Don't these radiation readings seem to be sky high?
According to Veterans Today, the normal background radiation used to be 5 to 40 CPM, and now those readings are often above 1,000 CPM
According to Veterans Today, the normal background radiation used to be 5 to 40 CPM, and now those readings are often above 1,000 CPM
JAPAN HAS EXPERIENCED HUGE INCREASES IN BACKGROUND RADIATION, SO THEY JUST RAISED THE 'ALLOWED' LIMITS OF RADIATION EXPOSURE OF CIVILIANS BY HUGE ORDERS OF MAGNITUDE, WHICH MEANS ALL OF THEIR PROBLEMS JUST DISAPPEARED
In Japan, they raised the amount of radiation that even infants and children can be exposed to up to from a maximum of 1 m/Sv per year, to 20 m/Sv per year, which is what full time ADULT nuclear workers in the US are allowed as healthy adult males.
Japanese Government Is Forcing People To Move Back Into Areas with Up To 10 Times Maximum Nuclear Workers Annual Radiation Exposure Limit
http://agreenroad.blogspot.com/2014/03/2014-japanese-government-moving-people.html
NIRS HAS DOCUMENTED HUGE INCREASE IN BACKGROUND RADIATION, FURTHER INCREASES COMING
Mary Olson of Nuclear Information and Resource Service (NIRS) talks about huge increases in background radiation in the US and fallacies around it via video... click on link to listen in.
The increase in background radiation documented here is due to DU weapons, nuclear plant accidents, plutonium releases, uranium mining and many other sources, most of which are kept secret, hidden or covered up. www.llrc.org
To view radiation levels this week, click on link for article that shows very high CPM readings all across the US, without even a nuclear accident happening. These radiation readings come from EPA monitors, but they have not always been this high. Where did all of this radiation in 2015 come from?
http://www.veteranstoday.com/2015/04/17/your-radiation-this-week-3/ON THE BEACH MOVIE CLIP; WHO SHOULD BE CONCERNED ABOUT BACKGROUND RADIATION LEVELS INCREASING FROM MAN MADE SOURCES?
A short movie clip from the movie On The Beach, about background radiation increasing..
Video; https://www.youtube.com/watch?v=kc7y8xs6QXw 1 min.
This is pretty close to how concerned everyone SHOULD be about background radiation levels increasing. The nuclear industry has done a really good PR job of making everyone very comfortable with a HUGE Orders Of Magnitude global increase in background radiation, since the beginning of the atomic age.
Nuke Professional talks about how much of the 'figuring' about 'natural' background radiation is actually a lie.. He provides a very simple, easy to read pie graph and explains how this lie works..
Bottom line, 'natural' background radiation has not increased over time. If anything, due to the decaying radioactive elements, the background radiation should slowly be going down and reducing over time.

 https://www.veteranstoday.com/2018/02/24/million-a-week-club-your-rad-this-week-in-the-us-6/
bo March 29, 2015 What one considers is 'frying' is subjective. But here's an old post from ISeePinkClouds… I think this is precious information that gives perspective on raising background levels, as he's been measuring radiation since the 70s, in the same location:

Radiation Concentrates In Micro Surface Layer Of Ocean Water; Radiation In Ocean Mist And Spray Can Travel Inland Up to 300 Kilometers
http://agreenroad.blogspot.com/2013/04/radiation-from-ocean-mist-and-spray-can.html
What would have made the background radiation increase from the start of open air nuclear weapons testing, up to now? Here is the evidence, showing how and why the background radiation is increasing....

Event Peak Ocean Radiation Reading In Bq/m³
For more on this, click on;
- 1900’s, average background radiation 0 mSv
- 1950’s, average background radiation 1 mSv
(max. public limit for radiation exposure)
First the Japanese government covered up, lied about and hid the high radiation levels resulting from the Fukushima mega disaster. Now the pro nuclear 'experts' are claiming that radiation is safe and are moving people back into radiation contaminated areas that are more radiation contaminated that the radiation exclusion zones around Chernobyl, while claiming that this is 'safe'. Is it really?
What does a 2,000 mSv per year external exposure mean (no internal radiation included)? For that we have to consult a radiation interpretation chart. This "Radiation Dose Chart" was compiled by Randall Munroe, with assistance from Ellen, Senior Reactor Operator at the REED Research Reactor.
Radiation Dose Chart
http://xkcd.com/radiation/
Source Annual Amount
Limit for nuclear workers 20 mSv/year
Avg. Yr. max dose for civilians (0.71 uSv/hr) 1 mSv/year (depends on country)
Rec. maximum yr. dose 50 mSv/year (5.7 uSv/hour)
(last 3 figures per American Nuclear Society)
We have explored and explained the external dose and what effect it has. Now let's explore internal radiation doses and the government action levels..

Iodine-131 = 3piC/L 0.11 Bq/L
Cesium-137 = 200 picocuries/L 7.41 Bq/L
Stronium-90 = 8 picocuries/L 0.30 Bq/L
Technetium-99 = 900 picocuries/L 33.3 Bq/L
Tritium = 20,000 picocuries/L 741 Bq/L
Uranium-238 = 30 µg/L (micrograms/liter)
Iodine-129 = 3 picocuries/L 0.11 Bq/L
Milk = 170 Bq/kg of iodine-131
http://fukushimafaq.wikispaces.com/Radiation+Allowable+Levels
Radioactive Tritium 300% More Deadly Than Cesium; Nuclear Power Industry Is Covering Up And Misleading Public About Dangers - 3 Million Fatalities 'Allowed' In 30 Years, Just In USA
http://agreenroad.blogspot.com/2014/06/radioactive-tritium-nuclear-power.html
Fukushima; Pacific Ocean Catastrophe Confirmed; via @AGreenRoad
http://agreenroad.blogspot.com/2012/04/fukushima-pacific-ocean-catastrophe.html

Dr. Rokke Former Military Reveals Dangers Of DU Dust; via @AGreenRoad
http://agreenroad.blogspot.com/2013/09/dr-rokke-former-military-reveals.html
The Canadian nuclear safety commission held a live broadcast, (video above). John Barrett was one of the many pro nuclear apologists who claimed radiation coming out of nuclear power plants is no different than background radiation, which is patently false and absurd. If you care to find out more about this global coverup around the dangers of low dose radiation, click on this link...
Global Corporations And The 1%; Art And Science Of Deception
http://agreenroad.blogspot.com/p/corporations-art-and-science-of.html
John Barrett stabbed all Canadians, all children specifically and even his own family in the back. The Canadian Nuclear Safety Commission during the live broadcast also stabbed children in the back, because they never reminded or corrected John Barrett misrepresentation/diluting of the facts by comparing inappropriate natural background radiation to man made plutonium and 1,200 other isotopes/elements such as radioactive Iodine.
The Canadian Nuclear Safety Commission acted as a moderator, and they never corrected any of these fabrications and lies. Globally, the nuclear regulators and agencies responsible for keeping communities safe have been compromised or taken over by the nuclear industry that they are supposed to regulate and control.
Because the regulators are not doing their jobs, it's now left up to mothers and people who care about kids to remind the world that man made radiation is POISON. But background radiation from the sun, background radiation from bananas, background radiations from potatoes, plus water or rocks are indigenous to earth. No one is concerned about those natural background kinds of radiations.
To summarize this section, what we have learned is that children are highly sensitive to radiation, 2,000 times more sensitive than adults. The problem with the pro nuclear lies is global, and we have detailed instances of the nuclear radiation danger coverup in Japan, the US and Canada, all pro nuclear industry, pro DU using, pro uranium mining, pro nuclear power plant building and exporting nations.
It is our choice. It is either time to put away all nuclear reactors and devices, or the nuclear industry/military will doom humanity to extinction, one way or another.
An amateur musician and artist put together this little dittie about background radiation.. You might enjoy it, and it ends on a positive hopeful note.
Video; https://www.youtube.com/watch?v=fvrlvn94UMk 4 min
-------------------------------------------------------------------------------------
1X Donation - Monthly Donation - AGRP Online - Pinterest Pics - Translate
AGRP Facebook Discussion Group - Facebook Daily News Page - Linkedin
Follow AGRP Daily News On Wordpress - AGRP Google Plus - Youtube
More ways; support A Green Road Project - AGRP Website - AGRP Tweets
A Green Road Eco Clothing/Products Store - AGRP Amazon Store
Get AGRP Delivered Daily To Your Email Address
Smartphone App - RSS Feed - Index
-------------------------------------------------------------------------------------
A Green Road Project; Teaching the Science of Sustainable Health. Keep asking - what works for 7 future generations without causing harm? Support AGRP and share this page; Twitter, Facebook, Email, Tumbler, Reddit, Stumbleupon, Google+, Wordpress and on Buffer
"Copyright Disclaimer under Section 107 of the Copyright Act 1976, "ALLOWANCES ARE MADE FOR FAIR USE" for purposes such as criticism, comment, news reporting, teaching, scholarship and research. Fair use is a use permitted by copyright statute, that otherwise might be infringing. Non-profit, educational or personal use tips the balance in favor of fair use." For more info go to:www.lawcornel.edu/uscode. Copyright protected material on this website is used in accordance with 'Fair Use', for the purpose of study, review or critical analysis, and will be removed at the request of the copyright owner(s). Please read Notice and Procedure for Making Claims of Copyright Infringement.
End
FUKUSHIMA INCREASED AIRBORNE AND OCEAN RADIATION LEVELS BY 2 TO 3 ORDERS OF MAGNITUDE, MORTALITY INCREASED BY HUGE AMOUNTS SINCE BEGINNING OF ATOMIC AGE
Trend of mortality rate from pancreatic cancer in Japan (Males) for the period prior to and following the release of fission products into the environment.”
From M. Segi, M. Kurihara, and T. Matsuyama, “Cancer Mortality in Japan (1899-1962)”, Department of Public Health, Tohoku University, Sendai, Japan, 1965.
http://www.berkeleycitizen.org/radiation/radiation1.htm
INCREASE FROM 0 BACKGROUND RADIATION IN THE 30's, WHEN IT WAS CLOSE TO ZERO CPM; AFTER CHERNOBYL IT WAS 2 CPM, AFTER FUKUSHIMA RADIATION LEVELS HAVE BEEN STEADILY INCREASING TO 3 MILLION CPM IN 98 CITIES

bo March 29, 2015 What one considers is 'frying' is subjective. But here's an old post from ISeePinkClouds… I think this is precious information that gives perspective on raising background levels, as he's been measuring radiation since the 70s, in the same location:
In the 70's and 80's "Background" Radiation measured zero counts per minute. If I received a count it might be within five minutes.
After Chernobyl I would receive two or three counts every five minutes. If there is such a thing as "Natural Background Radiation", it was very, very low here in West Texas.
Today in the same area I am reading about 18.8 counts per minute.
None of this is "Natural Background Radiation". It is from Chernobyl, Fukushima, the WIPP, and possibly now from the Ukraine.
In light of the fact that there have been twelve hundred above ground Nuclear Detonations in the United States, I do not believe that one can find "Natural Background Radiation" anywhere in the United States."
Is there evidence that what is being pointed to is in fact real? Just because all radioactive poison heavy metal is invisible, does not mean it is not harmless or does not exist.
Is there evidence that what is being pointed to is in fact real? Just because all radioactive poison heavy metal is invisible, does not mean it is not harmless or does not exist.
WHERE IS THE INCREASED BACKGROUND RADIATION COMING FROM? POISONED AIR FOR ALL
VETERANS TODAY: "Below is a Google translation of internationally renowned Physicist Dr. Paolo Scampa’s AIPRI Blog calculating the amount of U235 and Pu239 not consumed in the nuclear blasts worldwide.
Plutonium Air [1]
“The atomic fission tests (190 Mt) have entered into the atmosphere worldwide, are reduced to fine invisible dust of very deadly isotopes suspended as nanoparticles in the air. There’s about 84 tons of uranium and 49 tons of plutonium not consumed in the detonations of the Bombs for a total of 138 tons dispersed in addition to approximately 10.8 tons of fission products. Almost in its entirety they have drifted back to Earth.
[According to the accrual 137Cs / 90Sr of global impact, 95 Mt of Bomb cores were made with U235 and 95 Mt were made with Pu239. Because the average of 6% fission ordnance yield U235 and 10% of the Pu 239 in the bombs. 83.91 Metric Tonnes of U235 was not consumed and 49,02 t of Pu239 was not consumed and therefore released into the atmosphere from atomic fission tests.]”
“These fission weapons as soon as they had fulfilled their local explosive task transformed ipso facto: The part not consumed by the Bomb exists in countless floats and ubiquitous sub-munitions. Radiotoxic through respiration, the Isotopes are scattered as 10 thousand billion Sievert available through inhalation. This is artfully obscured in official inventories of UNSCEAR and distributed with an average rate of 650.45 nSv per Cubic Meter [m3] of air in an atmospheric layer 30 km high with a volume of 1,54E19 Cubic Meters. [((4/3) * 3.14159 * ((6371000 + 30000) 3- (63710003))) = 1,54E19 m3. 1,00E13 Sv / 1,54E19 m3 = 6,50E-7 Sv / m3.]”
50 years of breathing
“In 50 years everyone breathes around 405,400 m3 of air [487 tons] and, according to the radio-toxicity of the ICRP parameters, absorbs a 263.7 mSv dose because of this durable airborne contamination inherited from atomic tests by fission nSv 650.45 per m3. [50 years * 365.25 g * 22.2 m3 / g * 6,50E-7 Sv / m3 = 263.7 mSv.]”
“According to the ICRP (International Commission Radiological) the absorption of 263.7 mSv raises an individual’s risk of fatal cancer to 1.45% and induces one fatal case every 69 people who have suffered this same ionizing dose. [0.264 Sv * 5.5% risk factor for Sv = 1.45%.] For a historical population of 12 billion that has no escape from this absorbed dose, is unfortunately permitted to wait to claim 174 million victims. [0.264 Sv * 5.5% risk factor for Sv * 1,20E10 population = 174 million victims.]”
“Second is the MSK (Mancuso, Stewart & Kneale) absorption of these same 263.7 mSv raises an individual’s risk of fatal cancer to 15.82% and induces one fatal case every 6 people who have incorporated this same internal dose. [0.264 Sv * 60% risk factor for Sv = 15.82%.] For a historical population of 12 billion that has absorbed this dose the number of victims is considered to be 1.9 billion. [0.264 Sv * 60% risk factor for Sv * 1.20E10 population = 1.9 billion victims.]”
Translations of Yield
[(95000 Kt * 56,38 g / Kt) = 5,356E6 grams of U235 fissionati / 6% of fission yield = 8,926E7 grams of U235 “embarked” and 8,391E7 gr uneaten.]
[(95000 Kt * 57.34 g / Kt) = 5,447E7 grams of Pu239 fissionati / 10% fission yield = 5,447E7 grams of Pu239 “embarked” and 4,902E7 gr uneaten.]
[AIPRI Article End]
http://www.veteranstoday.com/2016/08/27/poisoned-air-for-all/CONTAMINATED AIR MASSES FROM FUKUSHIMA INCREASED AIRBORNE CESIUM LEVELS BY UP TO THREE ORDERS OF MAGNITUDE
Via Bill Duff November 10, 2014 Contaminated air masses from Fukushima, globally enhanced airborne 137Cs levels by 2 to 3 orders of magnitude
Environmental Science Technology (American Chemical Society), Published Sept. 3, 2013: Size Distributions of Airborne Radionuclides from the Fukushima Nuclear Accident at Several Places in Europe [...] Before the FDNPP accident, average 137Cs levels were typically of 1 μBq m−3 in Central Europe and lower average values
The massive amounts of radiation released from nuclear plants, nuclear bomb tests, mines, DU weapons, and more does not magically disappear.
ESTIMATE OF UP TO 2,000 BQ/M3 INCREASE IN OCEAN RADIATION LEVELS FROM FUKUSHIMA MEGA NUCLEAR DISASTER
Via Dick S November 10, 2014 "Does anyone know what the contents are, by weight, of the actinides within standard fuel rods. This should give us the approximate proportions of what is being released into the Pacific Ocean. We will also have to look at the effect of mox fuel entering the ocean."
Via stock November 10, 2014: the NRC provided the data to me for non MOX. I put it in this spreadsheet, enjoy, repost and use as you will, but credit to Nukepro on each use. I am missing the uranium and the Xenon, so these are conservative. Bottom line; 270 Bq/m3 in the entire Pacific, if it mixed evenly but it doesn't. Most stays in top 200 feet, less than .1% goes below 1,000 feet. So figure 1,000 to 2,000 Bq/m3 in the top 200 foot bio layer of the Pacific."
https://app.box.com/s/52rt3shbpicelduiqf8n
Total Fukushima Radiation Released Into Ocean, Air, Groundwater, Storage Tanks, etc
http://agreenroad.blogspot.com/2012/02/total-fukushima-radiation-released-into.html
TOTAL RADIATION RELEASED BY FUKUSHIMA MEGA DISASTER IS ORDERS OF MAGNITUDE WORSE THAN CHERNOBYL
http://agreenroad.blogspot.com/2012/02/total-fukushima-radiation-released-into.html
Radiation coming from man made, artificial radioactive elements, such as strontium, plutonium, cesium, uranium and about 1,200 other elements that come out of a nuclear reactor, spills, accidents, open air nuclear bomb tests and mines, plus medical uses of radiation all goes into the air, water and soil, which makes up background radiation. Just the one example above shows how background radiation increases..
http://agreenroad.blogspot.com/2013/04/radiation-from-ocean-mist-and-spray-can.html
PEAK PACIFIC OCEAN RADIATION READINGS HISTORICALLY
What would have made the background radiation increase from the start of open air nuclear weapons testing, up to now? Here is the evidence, showing how and why the background radiation is increasing....
Event Peak Ocean Radiation Reading In Bq/m³
2,400 Nuclear weapons testing peak -100 Bq/m³
Chernobyl caused a peak reading of - 5,000 Bq/m³
Fukushima caused a peak reading of - 180,000,000 Bq/m³
Chernobyl peak ocean level was around 50 times worse than 2,400 nuclear bombs going off.
Fukushima peak ocean level was around 100,000 times worse than 2,400 nuclear bombs going off.
For specifics on where this information came from, click on;
For specifics on where this information came from, click on;
Fukushima Ocean Radiation Compared To Chernobyl and 2,400 Open Air Nuclear Bomb Tests
For more on this, click on;
Fukushima Compared To Hiroshima, Chernobyl and 2,400 Open Air Nuclear Bomb Tests, Background Ocean Radiation Levels Pre/Post Atomic Age, Peak Ocean Radiation Level 180,000,000 Bq/m³
http://agreenroad.blogspot.com/2013/05/fukushima-radiation-measured-in-pacific.html
http://agreenroad.blogspot.com/2013/05/fukushima-radiation-measured-in-pacific.html
HISTORY OF BACKGROUND RADIATION 1950 To 2014, USING VARIOUS OFFICIAL GOVERNMENT SOURCES
- 1900’s, average background radiation 0 mSv
- 1950’s, average background radiation 1 mSv
(max. public limit for radiation exposure)
- 1960's, Due to
2,400 open air atomic bomb tests fallout 2 mSv
2,400 open air atomic bomb tests fallout 2 mSv
- 1994, average background radiation,
Chernobyl, TMI, other accidents and dumping; 3 mSv
Chernobyl, TMI, other accidents and dumping; 3 mSv
- 2002, average background radiation,
more accidents, spills, ocean/air dumping 3.6 mSv
more accidents, spills, ocean/air dumping 3.6 mSv
- 2014, average background radiation,
Fukushima mega disaster and more dumping 6.2 mSv
(max. limit for public has been raised 600%)
Fukushima mega disaster and more dumping 6.2 mSv
(max. limit for public has been raised 600%)
…the average annual radiation dose per person in the U.S. is 620 millirem (6.2 milliSieverts)."
http://www.epa.gov/radiation/understand/perspective.html

Day average chart for March 2016
http://sccc.org.au/wp-content/uploads/2016/03/Caloundra-local-average-background-radiation-levels-March-2016.jpg
Well, March 2016 had the highest March month average since records have been kept here. March and February this year have seen the highest March and February month averages since Fukushima. The wind direction this time of the year usually comes down the East Coast of Australia from the Northern tropics. The last two months have seen a lot of Eastern equatorial winds drawn South from the Eastern Pacific, and then directed up the East Coast of Australia.
Caloundra - March month average year comparisons
2012 - 24% above average
2013 - 32% above average
2014 - 31% above average
2015 - 33% above average
2016 - 39% above average
Cairns March 2016 Report – "Daily average radiation readings for last month March 2016 for Cairns (red) compared to your readings (orange). Readings were fairly steady, with a minor bump around the 20 – 24th of the month, which was associated with hot weather."
Thanks to the Cairn's station operator for providing this day average Cairns and Caloundra comparison chart.
http://sccc.org…
50 times more Uranium than normal was detected in air over Hawaii on the 21.03.2011.
http://fukushima-diary.com/2012/10/on-321201150-times-more-of-uranium238-was-measured-in-the-air-of-hawaii-than-2010/
IAEA CONFIRMS GLOBAL FALLOUT INCREASED DUE TO 2,400 OPEN AIR BOMB TESTS, REPROCESSING AND NUCLEAR ACCIDENTS
The results confirm that the dominant source of anthropogenic radionuclides in the marine environment is global fallout. The total 137Cs input from global fallout was estimated to be;
311 PBq for the Pacific Ocean,
201 PBq for the Atlantic Ocean,
84 PBq for the Indian Ocean and
7.4 PBq for the Arctic Ocean.
5 about 40 PBq of 137Cs was released to the marine environment from Sellafield and Cap de la Hague reprocessing plants.
The Chernobyl accident contributed about;
16 PBq of 137Cs to the sea, mainly the Baltic and Black Seas, where the present average concentrations of 137Cs in surface water were estimated to be about 60 and 25 Bq/m3 , respectively, while the worldwide average concentration due to global fallout is about 2 Bq/m3.
http://www-pub.iaea.org/MTCD/publications/PDF/TE_1429_web.pdf
Now add Fukushima on top of all of that massive amount of man made artificial heavy metal poison and radioactive dumping into the oceans..
Now add Fukushima on top of all of that massive amount of man made artificial heavy metal poison and radioactive dumping into the oceans..
JOHN F. KENNEDY - MAN MADE RADIOACTIVE ELEMENTS ARE POISON BOTH CHEMICALLY AS HEAVY METALS, AND RADIOACTIVELY LIKE MACHINE GUNS FIRING POISON BULLETS NON STOP INSIDE THE BODY IN ALL DIRECTIONS

A digital camera can 'see' radiation as multicolored speckles. The above picture is from a digital video camera in a high radiation environment.
A cloud chamber can also 'see' radiation, or make it visible.
French physicists have used a cloud chamber to reveal how high energy particles are fired out from uranium 238... making alpha, beta and gamma radiation visible.
Video; https://youtu.be/n_aAfwNiC1U 2 min.
Marushka March 11, 2015 ...Heart disease, multitude of cancers and other chronic diseases and new diseases are the legacy of the Atomic Age. There is no 'going back'. Turning waste into 'consumer goods' like 'eco cement' is exactly what the USA did beginning in the 1940s. And what we have in USA today is rapidly and still increasing cancer rates, lowered fertility, higher rates of heart disease….
"Radiation, in its simplest terms – figuratively, literally and chemically – is poison. Nuclear explosions in the atmosphere are slowly but progressively poisoning our air, our earth, our water and our food. And it falls, let us remember, on both sides of the Iron Curtain, on all peoples of all lands, regardless of their political ideology, their way of life, their religion or the color of their skin. Beneath this bombardment of radiation which man has created, all men are indeed equal."
John F. Kennedy, 1960
http://www.jfklibrary.org/Research/Research-Aids/JFK-Speeches/Milwaukee-WI_19600402-Wisconsin-Assoc-of-Student-Councils.aspx
Spreading heavy metal and radioactive invisible poisons around the world means that there will be sacrificial victims. Learn how many victims that there have been and will be in the future, due to the spreading of heavy metal poisons globally.....
Sacrifice Zones, Nuclear Power and the Sacrificial Victims System Is Spreading Globally As Part Of Predatory Capitalism
http://agreenroad.blogspot.com/2014/09/sacrifice-zones-nuclear-power-and.html
FUKUSHIMA INCREASED GLOBAL CESIUM IN AIR BY 2 TO 3 ORDERS OF MAGNITUDE
Experts: Fukushima ‘globally enhanced’ cesium-137 levels in air by 2 to 3 orders of magnitude — Radioactive plume that reached Europe “contaminated the land, and as a consequence the whole food chain” — Concentrations greatly underestimated

http://enenews.com/experts-fukushima-disaster-globally-enhanced-cesium-137-levels-in-air-by-2-to-3-orders-of-magnitude-radioactive-plume-that-reached-europe-contaminated-the-land-and-as-a-consequence-the-whol
It turns out that the radiation amounts estimated in the 'official' expert reports were grossly deficient, but that is how it works with every nuclear accident. The real figures are much higher, as shown by the chart and studies above.
SOUTHERN HEMISPHERE AND AUSTRALIA RADIATION LEVELS RISING AS WELL; PLUS INCREASED EACH YEAR AFTER FUKUSHIMA
vital1 November 17, 2014 Caloundra (Queensland Australia) 16th November 2014 –
There has been a general increase in background levels here over the last few days. It was 43% above pre-Fukushima average levels on the 16th. No rain, it was a clear fine day, so this was a free air increase.
Background levels so far this November are still less volatile than November 2012
and November 2013
This is the first time since March 2014 that background levels have reached this monitoring stations first Alert Level.
http://sccc.org.au/what-does-each-step-in-the-alert-level-colour-code-mean
Via vital1 April 9, 2016 Southern Hemisphere Background Report For March 2016, (39% above average)Stations Location Map,
http://sccc.org.au/monitoring/Australian-Map.jpg
What the chart colour codes indicate in the charts.
http://sccc.org.au/what-does-each-step-in-the-alert-level-colour-code-mean
Via vital1 April 9, 2016 Southern Hemisphere Background Report For March 2016, (39% above average)Stations Location Map,
http://sccc.org.au/monitoring/Australian-Map.jpg
What the chart colour codes indicate in the charts.
http://sccc.org.au/what-does-each-step-in-the-alert-level-colour-code-mean
Day average chart for March 2016
http://sccc.org.au/wp-content/uploads/2016/03/Caloundra-local-average-background-radiation-levels-March-2016.jpg
Well, March 2016 had the highest March month average since records have been kept here. March and February this year have seen the highest March and February month averages since Fukushima. The wind direction this time of the year usually comes down the East Coast of Australia from the Northern tropics. The last two months have seen a lot of Eastern equatorial winds drawn South from the Eastern Pacific, and then directed up the East Coast of Australia.
Caloundra - March month average year comparisons
2012 - 24% above average
2013 - 32% above average
2014 - 31% above average
2015 - 33% above average
2016 - 39% above average
Cairns March 2016 Report – "Daily average radiation readings for last month March 2016 for Cairns (red) compared to your readings (orange). Readings were fairly steady, with a minor bump around the 20 – 24th of the month, which was associated with hot weather."
Thanks to the Cairn's station operator for providing this day average Cairns and Caloundra comparison chart.
http://sccc.org…
@ Checkmate, "Do you ever get rain readings of over 200% of background in CPMs?"
Yes, In 2011, 2012 1nd 2013 we did, usually during the warmer months, which is our wet season. These Worldwide high Geiger counter rain water swab detections appeared to be mainly large Radon-222 washouts, because they decayed quickly in a few hours.
There where other isotopes present in these washout events, but it was the Radon-222 that caused the initial high Geiger counter detections when the rain swabs were tested. Radon-222 and Lead-210 are decay daughters of Uranium.
Theory why there seemed to be a significant Worldwide increase in Radon-222 washouts during 2011, 2012 1nd 2013.
http://fukushima-diary.com/2012/10/on-321201150-times-more-of-uranium238-was-measured-in-the-air-of-hawaii-than-2010/
All this extra Uranium that has been aerosolized into the air from the Fukushima Nuclear Disaster into the Northern Hemisphere atmosphere, was constantly releasing Radon gas. This would explain the increase in radioactive Radon gas coming across the equatorial boundary from the Northern hemisphere.
Also, there are constant steam releases from the underground super heated melted Nuclear reactor cores, hitting ground water. This releases a lot of extra Radon that is in the cores and soil at Fukushima. Watch this video from the 30.10.2012 to see a live shot of ground venting at the Fukushima…"
Radioactive Smoke/Steam Coming Out Of Ground And #3 Reactor Building At Fukushima, Rainbow Ion Spouts, Radioactive Iodine Measured In Fukushima/Tokyo Sewage Sludge, Xenon Gas
YEARLY INTERNAL RADIATION DOSE
All of the above doses are external ONLY. Now one has to add the internal radiation exposure, which is .28 mSv exposure per year, just from food and water radiation contamination, and this figure can go much higher, depending on if the food is grown in a radiation contaminated area.
https://en.wikipedia.org/wiki/Background_radiation
 Radiation levels in food, pre and post Fukushima
Dr. Rolf Sholz - Lethal Radioactive Manmade Cesium And Strontium Negative Health Effects (Diabetes, Heart Attacks) On Children And Adults, TOP SECRET Strontium Testing On 20,000 Dead Babies Bones In Australia
http://agreenroad.blogspot.com/2012/04/german-how-cesium-and-strontium-90.html
BONES AND TEETH PROVIDE DIRECT EVIDENCE OF INCREASED 'BACKGROUND' HEAVY METAL POISONS BEING ABSORBED BY ALL LIVING THINGS ON THE PLANET IN INCREASING AMOUNTS
Dr. Rolf Sholz - Lethal Radioactive Manmade Cesium And Strontium Negative Health Effects (Diabetes, Heart Attacks) On Children And Adults, TOP SECRET Strontium Testing On 20,000 Dead Babies Bones In Australia
http://agreenroad.blogspot.com/2012/04/german-how-cesium-and-strontium-90.html
Dr. Mangano - High and Rising Levels of Radioactive Strontium-90 in Nearly 5,000 Baby Teeth; The Tooth Fairy Project - Dr. Janette Sherman MD
http://agreenroad.blogspot.com/2014/11/high-and-rising-levels-of-radioactive.html
Fukushima Farmers Growing Food In Radioactively Contaminated Lands, Then Exporting It, Won't Eat It Themselves
http://agreenroad.blogspot.com/2013/10/farmers-growing-food-in-radioactively.html
http://agreenroad.blogspot.com/2014/11/high-and-rising-levels-of-radioactive.html
70 PERCENT OF ALL MAN MADE HEAVY METAL POISON RADIATION ACCUMULATING IN THE HUMAN BODY COMES IN VIA FOOD AND DRINKS
Fukushima Farmers Growing Food In Radioactively Contaminated Lands, Then Exporting It, Won't Eat It Themselves
http://agreenroad.blogspot.com/2013/10/farmers-growing-food-in-radioactively.html
Remember that 70% of all radiation coming into the body is INTERNAL and it bio accumulates over time, even if the levels of man made radiation coming in is fairly low, such as 10 to 50 Bq/kg. It may take several years to build up to toxic health damaging levels, but if the radiation keeps coming in over time on a constant basis, bioaccumulation is something that can be counted on.
Chelation methods are possible and work to some extent, but the best solution is to stop the building of nuclear fission reactors, and to quit eating radiation contaminated foods/drinks and/or move out of the radiation contaminated areas.
 Source/credit; Tekknorg

JAPANESE GOVERNMENT RESPONSE TO FUKUSHIMA RADIATION DISASTER WAS TO WITHHOLD RADIATION DATA AND NOT DISCLOSE THAT 3 REACTORS HAD MELTED DOWN FOR MONTHS
Gov’t officials are withholding Fukushima radiation data — Levels much higher than expected — Releasing numbers would “have a huge impact” — Over 2,000 millisieverts per year where residents are being encouraged to return
"The new results, however, were significantly higher than expected, with the largest gap coming in Kawauchi. There, the Cabinet Office team had predicted radiation doses of 1-2 millisieverts per day, but the data showed doses at between 2.6 and 6.6 millisieverts."
"The new results, however, were significantly higher than expected, with the largest gap coming in Kawauchi. There, the Cabinet Office team had predicted radiation doses of 1-2 millisieverts per day, but the data showed doses at between 2.6 and 6.6 millisieverts."
First the Japanese government covered up, lied about and hid the high radiation levels resulting from the Fukushima mega disaster. Now the pro nuclear 'experts' are claiming that radiation is safe and are moving people back into radiation contaminated areas that are more radiation contaminated that the radiation exclusion zones around Chernobyl, while claiming that this is 'safe'. Is it really?
What does a 2,000 mSv per year external exposure mean (no internal radiation included)? For that we have to consult a radiation interpretation chart. This "Radiation Dose Chart" was compiled by Randall Munroe, with assistance from Ellen, Senior Reactor Operator at the REED Research Reactor.
http://xkcd.com/radiation/
2,000 mSv per year = 2 Sieverts per year according to the above chart is FATAL over time, especially for children, who are up to 2,000 times more sensitive to the same dose.
What is very clear from scientific and medical research done all around the world, is that as infant deaths and cancers increase, the background radiation dose also increases.
Low Dose Radiation Dangers/Symptoms For Children And Adults
http://agreenroad.blogspot.com/p/low-dose-radiation-dangers-for-children.html
German study on infants and effects of increasing background radiation
http://agreenroad.blogspot.com/p/low-dose-radiation-dangers-for-children.html
German study on infants and effects of increasing background radiation
http://www.alfred-koerblein.de/background/deutsch/index.htm
The authorities and news media responsible for this news report, retracted the above radiation figures and said that they made a 'mistake'; Now they are saying that they actually meant that 2.6 to 6.6 was the mSv dose per year. It seems like all of their figures keep changing up and down, and 'mistakes' are just an everyday thing. No one can count on anything the nuclear 'experts' say, especially for radiation figures.
Economist: “Enormous spread of radiation” — Levels so high in hills of Iitate that locals dare not go near — 150 millisieverts/yr outside official’s home
"Outside Mr Sato's house, however, a reading of the equivalent of 150 millisieverts a year left your correspondent strangely reluctant to inhale."
Assuming the reading in a decontaminated downtown area is 150 mSv per year, what is the radiation reading up in the hills, where "no one dares to go"? Could the radiation in the hills where no decontamination work has been done be ten times as high, or 1,500 to 2,000 mSv per year? The only way to tell is to go there yourself and walk around with a radiation meter. But by all appearances, both the pro nuclear press and the nuclear 'experts' seem to keep getting caught in the web of their own lies.
From PubMed published study; "Based on the measured density of radionuclides at the highest contamination location during the present survey, an exposure rate of about 200 μGy h (0.2 mSv) at 1 m above the ground was estimated at the time of the radioactive deposition on March 15. At this location, the cumulative exposure would reach 50 mGy (50mSv) in the middle of May 2011" March to May = 3 months = 50 mSv, so 3 months x 4 = 200 mSv per year, correct?
Fukushima - (PanOrient News) Greenpeace radiation experts said they have confirmed radiation levels of up to ten micro Sieverts per hour (10.000 µSv) in Iitate village, 40 km northwest of the crisis-stricken Fukushima/Daiichi nuclear plant, and 20 km beyond the official evacuation zone, and these levels are high enough to require evacuation, the group said in a statement.
http://www.panorientnews.com/en/news.php?k=891
 Credit/source; Troy Livingston
WHAT RADIATION LEVELS ARE JAPANESE PEOPLE BEING ASKED TO LIVE IN?
So what is the real radiation reading in Iitate - Mura? The widely varying hourly or daily radiation readings itemized above were converted to annual radiation totals and put in a chart form below;
Source Annual Amount
Cabinet Office Team - 2.2 - 6.6 mSv/yr
GreenPeace 10 µSv/hr = 87.66 mSv/yr
Economist article - 150 mSv/yr radiation reading in town, MUCH higher out of town
PubMed Study - 200 mSv/yr documented in scientific study
Cabinet Office Team - 2,000 mSv/yr (later said it was a 'mistake')
Avg. Yr. max dose for civilians (0.71 uSv/hr) 1 mSv/year (depends on country)
Rec. maximum yr. dose 50 mSv/year (5.7 uSv/hour)
(last 3 figures per American Nuclear Society)
In the documented evidence and reports above, you can see radiation readings or reports all the way from 2.2 mSv to 2,000 mSv per year, so take your pick.. who knows what the real radiation reading really is in Iitate - Mura? This one small example of differing radiation figures shows how confusion and chaos reigns during and after a nuclear disaster, even up to 3 years later.
The true real life amount of radiation in this town is estimated to be between 87 to 200 mSv/yr, which is way above the industry maximum for nuclear workers at nuclear facilities of 20 mSv/yr, and four times higher than the 50 mSv/yr absolute maximum dose ANYONE should get per year, according to the American Nuclear Society. Bottom line, this town should be evacuated, not have people invited to come back and live in it, as the Japanese government and nuclear industry are doing.
This example also illustrates why every family should buy a high quality pancake style Geiger Counter. That way, you never have to trust anyone, and you can just take your own radiation reading. The truth is really very simple. Trust your own Geiger Counter. If calibrated correctly, it will not lie to you, but many other people will, because Billions to Trillions of dollars are at stake. Human lives are cheap by comparison. Would it be possible to sacrifice 30 million people just to keep the nuclear industry alive? Find out....
Tokyo; Is It Safe To Visit or Live In? via @AGreenRoad
http://agreenroad.blogspot.com/2012/03/tokyo-is-it-safe-to-visit-or-live-in.html
But if one had to figure out what was going on in Japan, it sure looks like the current pro nuclear government and nuclear industry are both downplaying/denying/minimizing just about all official radiation figures, because everyone but the government and nuclear experts are coming in at many orders of magnitude higher radiation readings than the 'officials' are, unless of course, they are really getting a 2,000 mSv/yr reading up there in the forests above town, that is.
INTERNAL RADIATION PRIMER
We have explored and explained the external dose and what effect it has. Now let's explore internal radiation doses and the government action levels..
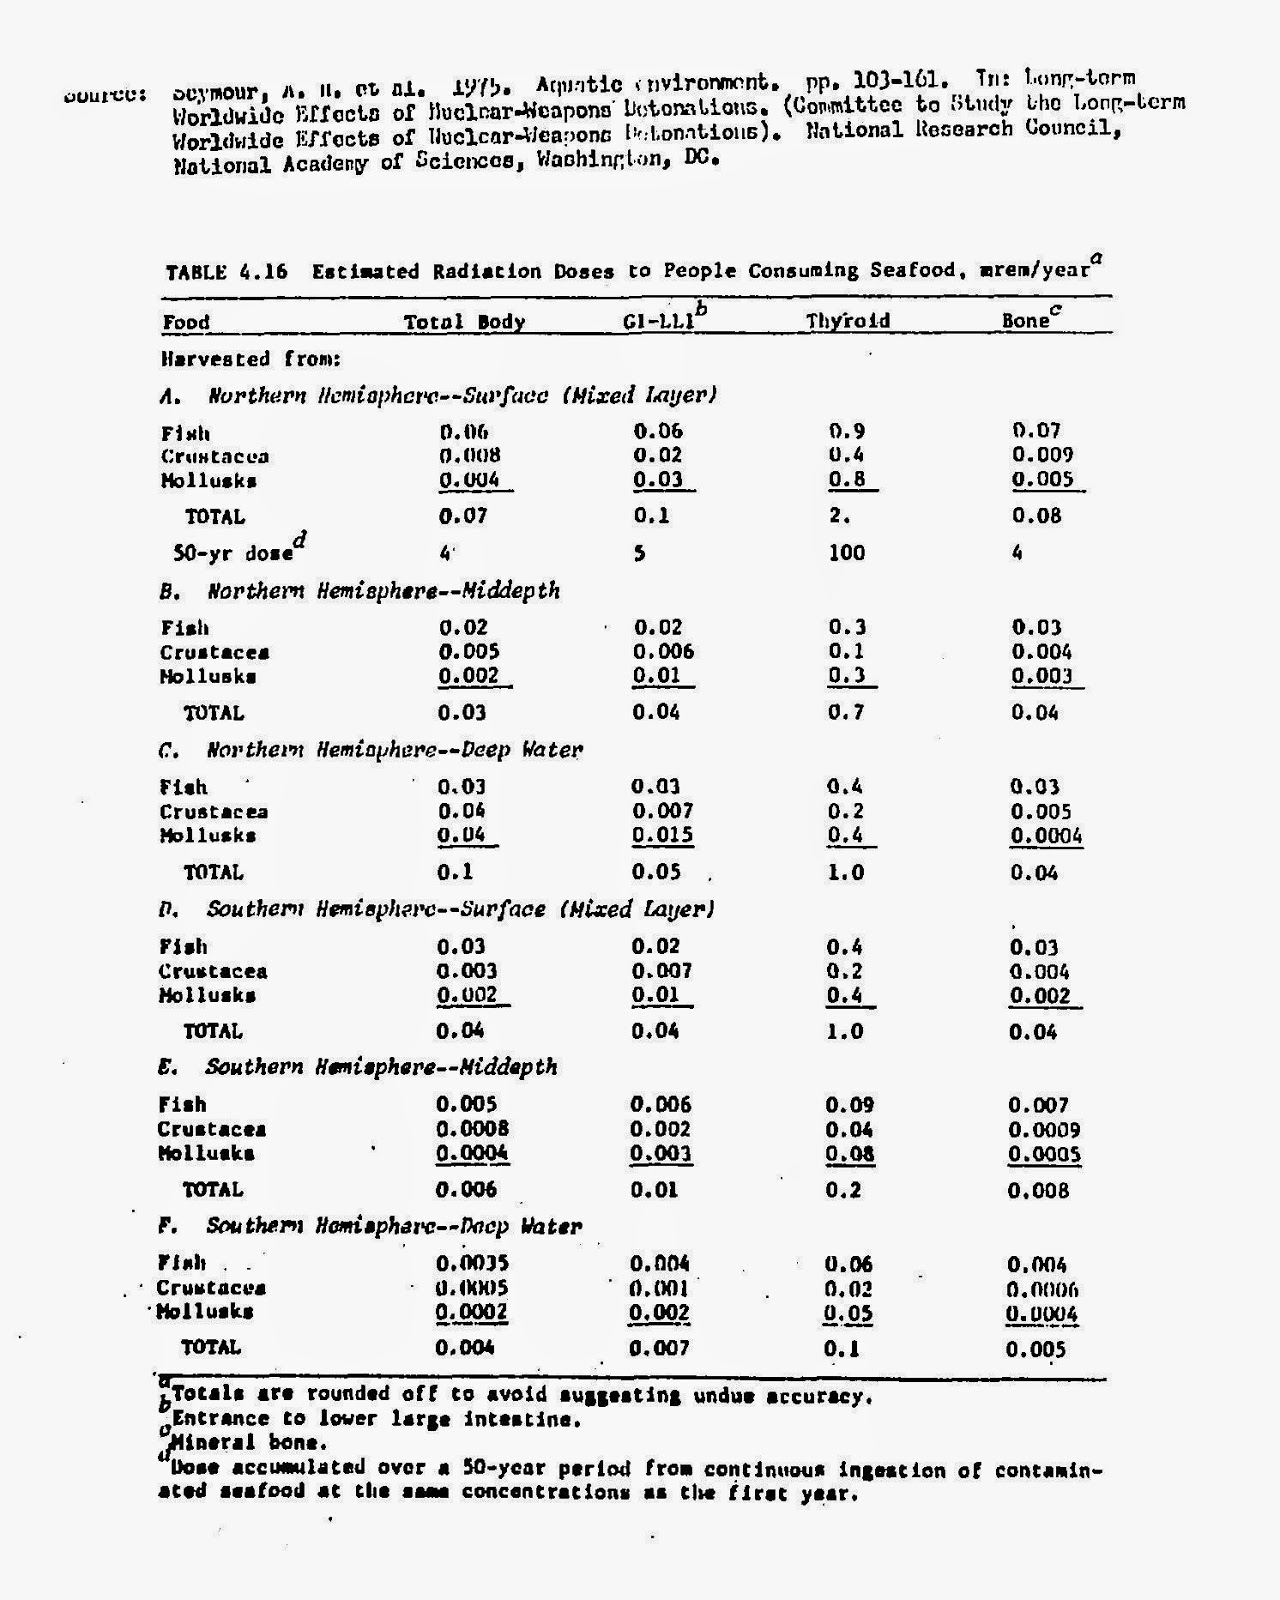
The above seafood radiation statistics were considered to be 'normal' back in 1975, after many years of open air nuclear testing. The total amount per person eating seafood was measured in millirem per year.
As you can see the total maximum of .1 millirem per year, which equals 0.001 m/Sv/yr. (which would equal just about zero Bq/kg in food and drink.)
Of course, this amount was raised exponentially higher as the nuclear industry continued to pour nuclear garbage into the global air, oceans, rivers, water and soil, year after year. In Japan the maximum allowed level in solid seafood is now 100 Bq/kg, and in the US it has been raised to 1,200 Bq/kg.
Seafood radiation 'allowed' before nuclear age 0 Bq/kg
Seafood radiation allowed after Fukushima in Japan 100 Bq/kg
Seafood radiation allowed after Fukushima in US 1,200 Bq/kg
As you can see the total maximum of .1 millirem per year, which equals 0.001 m/Sv/yr. (which would equal just about zero Bq/kg in food and drink.)
MAXIMUM SEAFOOD RADIATION LEVELS IN FOOD HAVE INCREASED EXPONENTIALLY SINCE THE BEGINNING OF THE CARBON AND NUCLEAR FUEL AGE
Of course, this amount was raised exponentially higher as the nuclear industry continued to pour nuclear garbage into the global air, oceans, rivers, water and soil, year after year. In Japan the maximum allowed level in solid seafood is now 100 Bq/kg, and in the US it has been raised to 1,200 Bq/kg.
Seafood radiation 'allowed' before nuclear age 0 Bq/kg
Seafood radiation allowed after Fukushima in Japan 100 Bq/kg
Seafood radiation allowed after Fukushima in US 1,200 Bq/kg
EPA MAXIMUM RADIATION LIMITS KEEPS ON INCREASING ALLOWABLE RADIATION LIMITS IN FOODS AND DRINKS
According to Wikispaces; the "EPA has established a maximum contaminant level of 4 millirem per year for beta particle and photon radioactivity from man-made radionuclide's in drinking water (and other liquids as shown below)
RADIATION SOURCE MAX AMOUNT ALLOWED
RADIATION SOURCE MAX AMOUNT ALLOWED
Iodine-131 = 3piC/L 0.11 Bq/L
Cesium-137 = 200 picocuries/L 7.41 Bq/L
Stronium-90 = 8 picocuries/L 0.30 Bq/L
Technetium-99 = 900 picocuries/L 33.3 Bq/L
Tritium = 20,000 picocuries/L 741 Bq/L
Uranium-238 = 30 µg/L (micrograms/liter)
Iodine-129 = 3 picocuries/L 0.11 Bq/L
Milk = 170 Bq/kg of iodine-131
http://fukushimafaq.wikispaces.com/Radiation+Allowable+Levels
Radioactive Tritium 300% More Deadly Than Cesium; Nuclear Power Industry Is Covering Up And Misleading Public About Dangers - 3 Million Fatalities 'Allowed' In 30 Years, Just In USA
http://agreenroad.blogspot.com/2014/06/radioactive-tritium-nuclear-power.html
The problem with all of these supposedly 'legal' amounts of different kinds of radiation (which must all be added together by the way), is that children start having health problems at much lower radiation amounts, as shown by these medical and scientific studies.
Now add together the 1,200 Bq/kg in solid food, and the above radiation amounts in liquids and you can see how kids especially will start having all kinds of health problems, just from 'legal' and allowed 'background' radiation in foods and drinks.
WHY IS 1,200 BQ/KG CESIUM LEGALLY ALLOWED IN FOOD OR DRINKS, WHEN AS LITTLE AS 10 TO 30 BQ/KG OF JUST ONE HEAVY METAL RADIOACTIVE POISON HAS BEEN PROVEN TO CAUSE HEALTH PROBLEMS IN CHILDREN?
Now add together the 1,200 Bq/kg in solid food, and the above radiation amounts in liquids and you can see how kids especially will start having all kinds of health problems, just from 'legal' and allowed 'background' radiation in foods and drinks.
As Little As 10-30 Bq/kg of Cesium Radiation In Kids Causes Health Problems; via @AGreenRoad
http://agreenroad.blogspot.com/2013/06/as-little-as-10-30-bqkg-of-cesium.html
http://agreenroad.blogspot.com/2013/06/as-little-as-10-30-bqkg-of-cesium.html
A massive amount of radiation was dumped into the Pacific after 3/11, by the Fukushima mega nuclear disaster. What effect will this have on kids' health?
http://agreenroad.blogspot.com/2012/04/fukushima-pacific-ocean-catastrophe.html

Source; http://www.davistownmuseum.org/cbm/Rad3.html
As Little As 10-30 Bq/kg of Cesium Radiation In Kids Causes Health Problems
http://agreenroad.blogspot.com/2013/06/as-little-as-10-30-bqkg-of-cesium.html
Low Level Nuclear Radiation In Food And Water, Geiger Counters
http://agreenroad.blogspot.com/p/low-level-nuclear-radiation-in-food-and.html
Effects Of Internal Low Level Nuclear Radiation
http://agreenroad.blogspot.com/p/effects-of-internal-low-level-nuclear.html
As you can see, the 'action levels' of internal radiation for infants and children are close to 2,000 Bq/liter and over 1,200 Bq/kg in foods (US action level), so these radiation sources must all added to the external dose. Man made radioactive elements build up in the body and bio accumulate and are not excreted. For children, permanent damage occurs at between 10-50 Bq/kg internal radiation dose.
Click on the link below to find out how and why this happens.
Click on the link below to find out how and why this happens.
As Little As 10-30 Bq/kg of Cesium Radiation In Kids Causes Health Problems
http://agreenroad.blogspot.com/2013/06/as-little-as-10-30-bqkg-of-cesium.html
INTERNAL RADIATION IS VERY DIFFERENT FROM EXTERNAL RADIATION, BUT NUCLEAR INDUSTRY REFUSES TO EVEN LOOK AT THIS
If one starts with a 84-200 mSv per year external dose, and then one adds on the above internal radiation that keeps bio concentrating up the food chain and then accumulating in children over time at legal radiation levels of 1,000 Bq/kg inside the food, what do you think the effect will be? It is impossible to have just external radiation exposure at the levels seen in Iwate, without also getting internal radiation contamination via many routes.
Low Level Nuclear Radiation In Food And Water, Geiger Counters
http://agreenroad.blogspot.com/p/low-level-nuclear-radiation-in-food-and.html
Effects Of Internal Low Level Nuclear Radiation
http://agreenroad.blogspot.com/p/effects-of-internal-low-level-nuclear.html
This level of 84-200 mSv per year external radiation, plus an unknown internal radiation dose on top of that is what the Japanese government is sending their kids and families back into. The pro nuclear industry apologists and Japanese government are claiming that this is all 'safe'. Much of Japan is just like this example.
But this one nuclear industry sponsored insanity and Catch 22 example is not an isolated incident at just one location. This same type of thing is happening GLOBALLY, all over the world, in many heavily radiation contaminated places, many of which the US military or government is responsible for creating. What follows is just another example, which is the very tip of the iceberg, if you care to dive into this further.
DEPLETED URANIUM MIXED WITH PLUTONIUM IS BEING SPREAD ALL OVER THE WORLD, VIA DU WEAPONS
But this one nuclear industry sponsored insanity and Catch 22 example is not an isolated incident at just one location. This same type of thing is happening GLOBALLY, all over the world, in many heavily radiation contaminated places, many of which the US military or government is responsible for creating. What follows is just another example, which is the very tip of the iceberg, if you care to dive into this further.
Man made heavy metal poisons plus radiation from things such as depleted uranium have caused 80 percent of all babies in Fallujah Iraq to look like horrible Dr. Frankenstein genetic science experiments gone wrong. The nuclear industry and US military response is that the DU dust is safe enough to eat for breakfast and has no measurable health effects. DU dust is present in many US cities and towns, because DU weapons are 'tested' and used everywhere.
Dr. Rokke Former Military Reveals Dangers Of DU Dust; via @AGreenRoad
http://agreenroad.blogspot.com/2013/09/dr-rokke-former-military-reveals.html
PRO NUCLEAR EXPERTS DENY THERE IS ANY DANGER FROM MAN MADE RADIOACTIVE ELEMENTS
The Canadian nuclear safety commission held a live broadcast, (video above). John Barrett was one of the many pro nuclear apologists who claimed radiation coming out of nuclear power plants is no different than background radiation, which is patently false and absurd. If you care to find out more about this global coverup around the dangers of low dose radiation, click on this link...
Global Corporations And The 1%; Art And Science Of Deception
http://agreenroad.blogspot.com/p/corporations-art-and-science-of.html
John Barrett stabbed all Canadians, all children specifically and even his own family in the back. The Canadian Nuclear Safety Commission during the live broadcast also stabbed children in the back, because they never reminded or corrected John Barrett misrepresentation/diluting of the facts by comparing inappropriate natural background radiation to man made plutonium and 1,200 other isotopes/elements such as radioactive Iodine.
The Canadian Nuclear Safety Commission acted as a moderator, and they never corrected any of these fabrications and lies. Globally, the nuclear regulators and agencies responsible for keeping communities safe have been compromised or taken over by the nuclear industry that they are supposed to regulate and control.
Because the regulators are not doing their jobs, it's now left up to mothers and people who care about kids to remind the world that man made radiation is POISON. But background radiation from the sun, background radiation from bananas, background radiations from potatoes, plus water or rocks are indigenous to earth. No one is concerned about those natural background kinds of radiations.
To summarize this section, what we have learned is that children are highly sensitive to radiation, 2,000 times more sensitive than adults. The problem with the pro nuclear lies is global, and we have detailed instances of the nuclear radiation danger coverup in Japan, the US and Canada, all pro nuclear industry, pro DU using, pro uranium mining, pro nuclear power plant building and exporting nations.
DEBUNKING NUCLEAR INDUSTRY DECEPTIONS
The pro nuclear apologists around the world all use the same playbook of lies. They love to TRY and compare man made radioactive elements with 'natural' background radiation. This deceptive practice is shown in action in the above video, and debunked in this material that follows below.
What is natural background radiation? Is there a difference between that and man made radioactive isotopes/elements/actinides? What is the difference between internal and external radiation? What is the difference between banana radiation and man made radiation?
Life has mostly acclimated to earths low level background radiation over millions or billions of years of evolution. But life and humans have NOT acclimated nor have any defense against man made plutonium for example, which was not present for millions of years on Earth. We have no defense against plutonium, in ANY amount, just as ONE example out of the 1,300 poisons that spew from nuclear reactor accidents and spent fuel processing plants.
For more details, click on the following links to find out more...
Radioactive Potassium In Bananas Compared To Cesium, Plutonium, Uranium And Iodine via
http://agreenroad.blogspot.com/2012/03/radioactive-bananas-peeling-mystery.html
Radiation dangers in food and water
http://agreenroad.blogspot.com/2012/03/radiation-contamination-standards-for.html
Bananas, rocks and sunlight are natural background radiation that has nothing to do with nuclear radiation and those things do not as a rule make 80% of babies look like Fallujah babies, or Chernobyl babies, or Fukushima babies. Sunlight does not create this problem...
Comparing Sunlight To Man Made Radioactive Elements; via @AGreenRoad
http://agreenroad.blogspot.com/2014/03/comparing-sunlight-to-man-made.html
Comparing Sunlight To Man Made Radioactive Elements; via @AGreenRoad
http://agreenroad.blogspot.com/2014/03/comparing-sunlight-to-man-made.html
Farmers do not wear those expensive specialized nuclear radiation particle outfits and fancy microfilter radiation masks that cover the whole face to harvest potatoes, or bananas, or to make rock gardens. Natural rock radiation does not cause 80% of the kids to have birth defects and health problems at birth, but man made radioactive elements do.
Is There 'Natural' Plutonium And Are There 'Natural' Fission Reactions? via @AGreenRoad
http://agreenroad.blogspot.com/2014/01/is-there-natural-plutonium-and-are.html
Is There 'Natural' Plutonium And Are There 'Natural' Fission Reactions? via @AGreenRoad
http://agreenroad.blogspot.com/2014/01/is-there-natural-plutonium-and-are.html
HOW DANGEROUS IS PLUTONIUM?
The only people that wear radiation protection outfits and dosimeters plus full face masks are nuclear plant workers and radiation accident cleanup workers. Man made nuclear radioactive elements are supposed to be locked away for a billion years, and be kept away from all living beings. Otherwise, children are born who look like jellyfish, or they are horribly disfigured, or have other internal birth defects, mental deficiencies, etc. If man made radiation is so safe, why are they taking all of these extreme precautions and building redundant defenses into nuclear power plants?
According to Helen Caldicott MD, one POUND of plutonium (if spread around in the form of nano particle dust and inhaled equally by every person on Earth, is enough to kill all babies and all children on Earth, (and adults too). Fukushima released 600-6000 pounds of this genocidal material, and much of it traveled all around the world. One pound of bananas made into dust and inhaled will not result in anything happening.
How Dangerous Is 400-6000 Pounds Of Plutonium Nano Particle Dust Liberated By Fukushima?
http://agreenroad.blogspot.com/2013/08/how-dangerous-is-400-6000-pounds-of.html
How Dangerous Is 400-6000 Pounds Of Plutonium Nano Particle Dust Liberated By Fukushima?
http://agreenroad.blogspot.com/2013/08/how-dangerous-is-400-6000-pounds-of.html
What makes this worse is that all nuclear plants are switching to plutonium fuel and away from uranium, but it is 1,000,000 times more dangerous, toxic and unstable.
PROTECT YOUR CHILDREN. Stop this insanity. Do it for them, if not for yourself or your community. SAVE THE CHILDREN!
MASSIVE COVER UP; HELP PUT A STOP TO THE NUCLEAR CABAL, THIS FIGHT CAN BE WON! GET INVOLVED!
PROTECT YOUR CHILDREN. Stop this insanity. Do it for them, if not for yourself or your community. SAVE THE CHILDREN!
Dr Chris Busby is interviewed in video by Theo Chalmers on Sky TV's "One Step Beyond" about Fallujah, Fukushima and the cover-ups over the health effects of exposure to low dose radiation that has been or is still being released from places like Chernobyl, TMI, and Fukushima, just to name a few of the hundreds of accidents and releases that happen on a regular basis. He talks about winning lawsuits against the nuclear industry on behalf of victims. It is possible to fight back and win.
Video; https://www.youtube.com/watch?v=0tkUU4IeSxs 46 min.
Bottom line, the 600% increase in background radiation since the beginning of the atomic age is not due to sunlight, cosmic rays, bananas, air plane flights, dental x-rays or even natural uranium rocks, which have been laying around for millions to billions of years. Most of this increase in health hazard and radiation risk is coming is from the nuclear/military and/or medical industry.
http://nukeprofessional.blogspot.com/p/baseline-is-just-one-of-lies.html
These pro nuclear apologists are supporting the mines, processes, uses, burning and then disposing of highly radioactive nuclear waste in the public commons which consists of air, water, ground, plants, animals and humans.
Nuclear Accidents, Recycling Nuclear Weapons/Fuel
http://agreenroad.blogspot.com/p/nuclear-accidents-around-world.html
Uranium Mining and Enrichment - Nuclear Bomb -Nuclear Fuel Manufacturing
http://agreenroad.blogspot.com/p/uranium-mining-and-enrichment.html
Nuclear Reactor Recertification
http://agreenroad.blogspot.com/p/nuclear-reactor-recertification.html
Long Term Storage Of Nuclear Fuel, Nuclear Waste
http://agreenroad.blogspot.com/p/recycling-or-long-term-storage-of.html
The trend around background radiation is this; it is going up. The number of nuclear accidents is going up, not down. The radiation related accidents that are happening are getting worse by orders of magnitude, but so are the cover ups, such as Fukushima.
Worst Case Scenario Around The Fukushima Mega Nuclear Disaster, Vs Best Case Scenario Presented By Nuclear Industry
http://agreenroad.blogspot.com/2015/10/worst-case-scenario-around-fukushima.html
Radiation In Food/Water/Products, Geiger Counters, Dosimeters, Test Labs, Radiation Readings, Conversions
http://agreenroad.blogspot.com/p/low-level-nuclear-radiation-in-food-and.html
The trend in terms of diseases and cancer rates (caused by radiation) is going up, not down. The trend in all kinds of diseases that are caused by low dose radiation are going up, not down. It is not difficult to predict the future. Either this negative trend keeps growing, or it all ends suddenly, via something that happens about every 200 years, but which the nuclear industry is not prepared for.
Super Solar Storm To Hit Earth - 'Carrington Effect'; 400 Nuke Plants Will Melt Down/Explode
http://agreenroad.blogspot.com/2012/03/super-solar-storm-predicted-to-hit-2013.html
Video; https://www.youtube.com/watch?v=0tkUU4IeSxs 46 min.
WHERE IS ALL OF THIS 'EXTRA' RADIATION COMING FROM?
Bottom line, the 600% increase in background radiation since the beginning of the atomic age is not due to sunlight, cosmic rays, bananas, air plane flights, dental x-rays or even natural uranium rocks, which have been laying around for millions to billions of years. Most of this increase in health hazard and radiation risk is coming is from the nuclear/military and/or medical industry.
http://nukeprofessional.blogspot.com/p/baseline-is-just-one-of-lies.html
These pro nuclear apologists are supporting the mines, processes, uses, burning and then disposing of highly radioactive nuclear waste in the public commons which consists of air, water, ground, plants, animals and humans.
EVERY STAGE OF THE NUCLEAR FUEL CYCLE RELEASES MASSIVE AMOUNTS OF HEAVY METAL RADIOACTIVE POISONS INTO THE AIR, GROUND AND WATER
Nuclear Accidents, Recycling Nuclear Weapons/Fuel
http://agreenroad.blogspot.com/p/nuclear-accidents-around-world.html
Uranium Mining and Enrichment - Nuclear Bomb -Nuclear Fuel Manufacturing
http://agreenroad.blogspot.com/p/uranium-mining-and-enrichment.html
Nuclear Reactor Recertification
http://agreenroad.blogspot.com/p/nuclear-reactor-recertification.html
Long Term Storage Of Nuclear Fuel, Nuclear Waste
http://agreenroad.blogspot.com/p/recycling-or-long-term-storage-of.html
The trend around background radiation is this; it is going up. The number of nuclear accidents is going up, not down. The radiation related accidents that are happening are getting worse by orders of magnitude, but so are the cover ups, such as Fukushima.
Worst Case Scenario Around The Fukushima Mega Nuclear Disaster, Vs Best Case Scenario Presented By Nuclear Industry
http://agreenroad.blogspot.com/2015/10/worst-case-scenario-around-fukushima.html
Radiation In Food/Water/Products, Geiger Counters, Dosimeters, Test Labs, Radiation Readings, Conversions
http://agreenroad.blogspot.com/p/low-level-nuclear-radiation-in-food-and.html
WHAT HAPPENS IF NUCLEAR INDUSTRY IS NOT STOPPED AND SHUT DOWN?
The trend in terms of diseases and cancer rates (caused by radiation) is going up, not down. The trend in all kinds of diseases that are caused by low dose radiation are going up, not down. It is not difficult to predict the future. Either this negative trend keeps growing, or it all ends suddenly, via something that happens about every 200 years, but which the nuclear industry is not prepared for.
Super Solar Storm To Hit Earth - 'Carrington Effect'; 400 Nuke Plants Will Melt Down/Explode
http://agreenroad.blogspot.com/2012/03/super-solar-storm-predicted-to-hit-2013.html
It is our choice. It is either time to put away all nuclear reactors and devices, or the nuclear industry/military will doom humanity to extinction, one way or another.
BACKGROUND RADIATION SONG
An amateur musician and artist put together this little dittie about background radiation.. You might enjoy it, and it ends on a positive hopeful note.
Video; https://www.youtube.com/watch?v=fvrlvn94UMk 4 min
WHAT YOU CAN DO
Natural Radiation Chelation Methods And Supplies - Air/Water Purification, Vitamins, Minerals, Herbs, Such As Pectin, Zeolite, Kelp, Iodine, Alginate
DONATE, SHARE, CONNECT, FOLLOW, COMMENT, COLLABORATE
Please help AGRP get this news out... thanks for your generous and very appreciated support! What you support grows and expands. What you withhold support from shrinks, shrivels and disappears. Even .50 cents per month is a great help. What is teaching the science of sustainable health worth?-------------------------------------------------------------------------------------
1X Donation - Monthly Donation - AGRP Online - Pinterest Pics - Translate
AGRP Facebook Discussion Group - Facebook Daily News Page - Linkedin
Follow AGRP Daily News On Wordpress - AGRP Google Plus - Youtube
More ways; support A Green Road Project - AGRP Website - AGRP Tweets
A Green Road Eco Clothing/Products Store - AGRP Amazon Store
Get AGRP Delivered Daily To Your Email Address
Smartphone App - RSS Feed - Index
-------------------------------------------------------------------------------------
A Green Road Project; Teaching the Science of Sustainable Health. Keep asking - what works for 7 future generations without causing harm? Support AGRP and share this page; Twitter, Facebook, Email, Tumbler, Reddit, Stumbleupon, Google+, Wordpress and on Buffer
"Copyright Disclaimer under Section 107 of the Copyright Act 1976, "ALLOWANCES ARE MADE FOR FAIR USE" for purposes such as criticism, comment, news reporting, teaching, scholarship and research. Fair use is a use permitted by copyright statute, that otherwise might be infringing. Non-profit, educational or personal use tips the balance in favor of fair use." For more info go to:www.lawcornel.edu/uscode. Copyright protected material on this website is used in accordance with 'Fair Use', for the purpose of study, review or critical analysis, and will be removed at the request of the copyright owner(s). Please read Notice and Procedure for Making Claims of Copyright Infringement.
Background Radiation Has Increased By 600 To 60,000 Percent Globally, State By State In USA - 0 Before Nuclear Age, 1 mSv In 1950 To Over 6 mSv Today; Physicist Dr. Paolo Scampa, Dr Busby Weigh In On Evidence, Data, Root Causes